|
|||
Is the market bottoming and nobody knows it?David Banister If you're at all like me, you're a bit tired of the negative headlines and the media frenzy that goes with it. The economic data is horrible and consumer confidence readings are as low as 1981-1982 before the last bull market began. The bulls vs. bear investor sentiment surveys are running consistently high patterns of more bears than bulls for months now. The news is unlikely to get much better for a few more quarters at least. With the above said, I'd like to make a contrarian case that a multi year cyclical bull market is now possible. This opinion is based on historical criteria normally associated with bear market bottoms, as well as my own formulations that I have added. If you'll "Bear" with me, let's address some of those now.
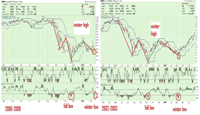
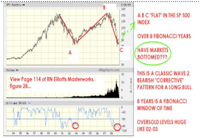
These are just but a few of multiple samplings I could give as bottoming indicators. Obviously the stock market is your best forecaster of economic peaks and valleys. As of the day of this writing, the market doesn't yet seem to be predicting a bottom in the economy this year. Perhaps consumer confidence can in fact fall further before bottoming and turning higher. This period of time is of course much different from the 2002-2003 window. Going all the way back to 1981-1982 the concern was over high interest rates and inflation. This time around we have low interest rates and the concern is over deflation. The rubber band was stretched one way in 81-82 and it's the other way now in 08-09. These usually revert to the mean, so one could surmise inflation starts to come back soon along with higher interest rates. What does it all mean? I'm more of a believer that human behavior dictates the intermediate and longer term movements of the stock market, and not earnings or interest rates or other traditional measures. When the herd is entirely pessimistic, consumer confidence is the worst in 27 years, and we've had 8 plus years of a massive trading range market with negative net returns... perhaps it's time to get bullish. I've included a few charts showing the 2002-2003 Russell patterns compared to 2008-2009. The other chart is the long term 10 year S and P 500 index chart showing the ABC pattern aforementioned. Feedback on this article would be much appreciated and can be addressed to dbanister@cox.net. (Click on images to enlarge) Feb 23, 2009 David Banister has been quoted in the past on CBS Marketwatch and has had articles published on several investor focused websites within the past few years including 321Gold.com, TheAUreport.com, Stockhouse.com etc. David can be reached at dbanister@cox.net. The opinions of the author are his opinions only and not meant to be construed or interpreted as investment advice. Markets are extremely volatile and you should consult an Investment Advisor or Professional whenever possible. |


