|
|||
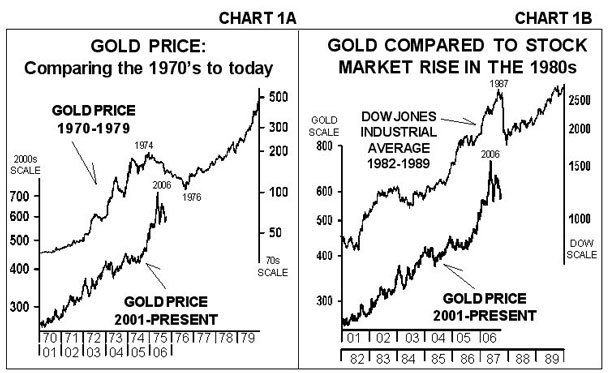
Watch the Major TrendMary Anne & Pamela Aden Last time we wrote about the importance of the major gold trend and our strategy for dealing with it, as well as market volatility. When gold fell steeply this month we know it was nerve wracking, but it's important to remember that gold's major trend remains up and it's still bullish. GOLD'S 65 WEEK MOVING AVERAGE IS THE KEY Gold's 65-week moving average is the most important indicator to follow. It's been excellent in identifying gold's major trends. Gold has been above this moving average since 2001 and it's kept us on the right side of the major rise since then. As long as gold stays above this average at $549, it'll continue signaling to stay with gold. But recent volatility has reinforced the lesson that nothing is set in stone. We have to be ready for whatever the market throws our way, and not what we think. If a market is going down, for instance, and we think it should be rising, it's a huge mistake to hang on because you believe it shouldn't be declining no matter how many reasons there are to the contrary. You simply have to keep an open mind. ON THE ALERT If gold is bullish and it's poised to rise further, then why are we even talking about this? One reason is due to simple market behavior. Looking at the charts you'll see what we mean. First, note that in gold's great bull market of the 70s, gold rose 2328% but it did not go straight up (see Chart 1A). The bull market was temporarily interrupted after about five years, between 1974 and 1976, when gold fell nearly 50%. Comparing the current bull market since 2001 to the 1970s, you can see that the time frame is now similar to this 74-76 period. And while that doesn't necessarily mean that gold has to repeat its 70s downward experience, it's interesting that we see this pattern in other markets too. Take a look at the Dow Industrials on Chart 1B as another example. Here too you'll see that when the Dow was about five years into its 1980s bull market, it suffered a quick drop of 36% in 1987 before resuming its bull market rise.
Again, comparing gold's current bull market to the Dow in the 80s, it's now at that critical time period. While this may or may not be a coincidence, it's something you should be aware of and be on the alert. In the event history repeats, the 65-week moving average will be our guide and it'll tell us if we're going to see a repeat performance or not. It'll also determine our strategy. If gold breaks below this average, for instance, we believe it would be a temporary situation, just like it was in the 70s and 80s, but we'd still want to play it safe, just in case it ends up not being temporary. With the economy slowing and bond prices rising, we can't blindly rule out this possibility. But do we think it's going to happen? No, and there are three main reasons why... REASONS WHY NOT First, with the U.S. loaded up to its neck in debt, the Fed knows this is deflationary and it wouldn't take much for an economic slowdown or recession to result in deflation. This is something the Fed will avoid by any means. It's essentially said so many times, confirmed by its actions. Second, with the real estate market slowing, the need to take action has become more urgent and the Fed will do what it's always done when push comes to shove... it'll start adding liquidity and interest rates will decline. This will help ease the burden for home owners and buyers, it'll help keep the economy afloat and it'll keep inflation brewing. The leading inflation indicator is backing this up and so is the ongoing rise in the stock market, which would be falling sharply if a serious recession was on the horizon. Third, the baby boomers will start retiring in 2008 and they represent the largest population bulge in U.S. history at nearly 80 million. Considering that 40% of the boomers have no retirement plan and their average overall net worth is $60,000, the majority do not have enough money to retire. This means they'll be depending on social security and based on this alone, it guarantees even more debt and inflation for as far as they eye can see. It also tells us that gold and commodities will continue to rise in the years to come, especially combined with China's ongoing growth and demand, along with that of other emerging countries. BUT WHAT'S NEXT? Our favorite gold timing indicator shows gold's A through D intermediate cyclical patterns, which have been consistent since the late 1960s (see Chart 2). The As and Cs coincide with gold rises while the Bs and Ds identify gold declines.  This year, gold has been increasingly volatile and this resulted in our relabeling of the patterns, which we believe better reflect market reality. The bottom line is that gold's huge rise from November 05 to May 06 was a long, extended double C rise. Gold rose nearly 58%, which was about three times more than the average gains of the previous C rises since 2001. Gold then dropped 22% in a D decline, which was also nearly double the average of the post 2001 D declines, reflecting stronger volatility on the upside and downside. In June 06 gold embarked on an A rise which was again, the strongest A since 2001 and a B decline is currently in process. So far, it too has been the steepest B in this bull market and it's now entering its seventh week. The average timing for previous B declines has been six weeks and if gold now holds above the June D low at $562, a renewed sustained rise could begin at any time. The leading indicator is reinforcing this since it's extremely oversold. If gold, however, closes and stays below $562 (basis December), a double D bottom cannot be ruled out, which could take gold down to its 65-week moving average at $549. If this relabeling is correct, then gold will soon embark on a C rise, which is the strongest rise in the pattern. It may be starting now but if gold closes and stays above $605, that'll be the first important sign that the B decline is over and a C rise is beginning. That'll be reinforced with gold closing above $650 and $668. Above $668, gold will then be headed toward the May high at $722 and if the upcoming C rise is normal, gold should exceed that level. This upcoming C rise will tell us a lot about the overall strength of the bull market. So no, we're not worried about gold over the long-term. And if the economy is indeed headed for a soft landing, then we're not concerned about a temporary interruption in gold's bull market either. A hard landing would be another story and again, we just want you to be on the alert for this possibility as well. Oct 16, 2006 For more information, go to http://www.adenforecast.com/ or http://www.goldchartsrus.net/ 321gold Inc |