|
|||
Which way next for goldMary Anne & Pamela Aden Gold remains bullish, despite the drop in gold shares and the rising U.S. dollar. This alone is unusual and it raises an important question... Could gold shares be leading the way down for gold, or will gold's firmness eventually pull the shares back up?
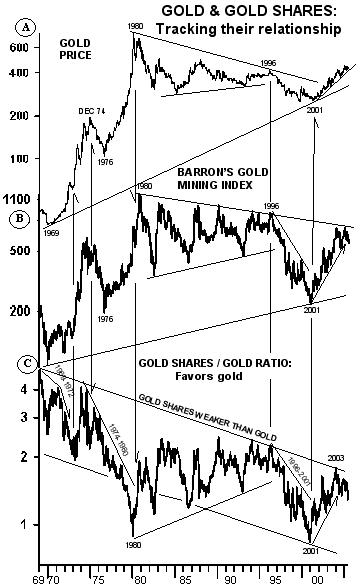
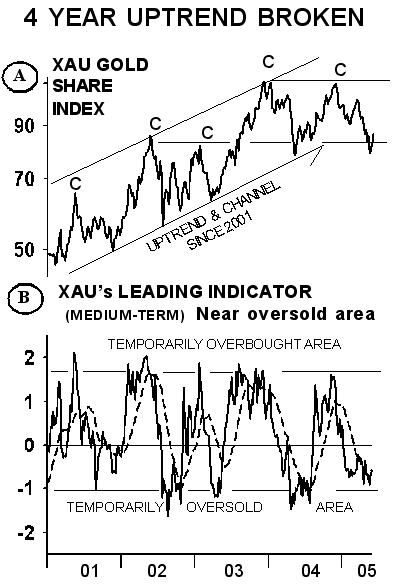
GOLD SHARES: Fell at critical juncture The fall in gold shares means a critical juncture was resolved in favor of gold and it was bad for gold shares. As you can see on Charts 1B and C, gold shares, and the ratio of gold shares to gold both resisted and fell from major downtrends, breaking below their uptrends since 2001. On the other hand, gold's major four year trend is up (see Chart 1A). click on images --> For now, gold shares are oversold (see Chart 2B). This means we'll likely see a further bounce up in gold shares in the upcoming months. The recent fall caused the XAU to move into a sideways band (see Chart 2A). If XAU now stays above 82, it could eventually rise to possibly its 2003-04 prior C highs as it rises from the lower to the higher side of the band. This is why we think it's best to keep the gold and silver shares you have rather than sell them now. Once the coming intermediate rise is over, however, we'll reevaluate our gold share position and either keep some or sell and move heavier into gold, depending on the outcome. BIG PICTURE: Gold better The big picture is suggesting that gold could remain stronger than the shares for some time. Charts 1A and B show the relationship between gold and gold shares since 1969. Here you can see that gold and gold shares generally move together on a major trend basis. There have only been three time periods since 1969 when gold shares were much weaker than gold.
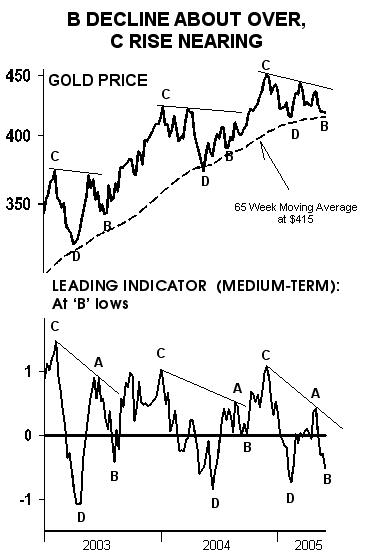
In both cases, gold shares peaked before gold. Both then fell together but gold shares declined much more than gold prior to both markets reaching bottoms in 1969 and 1976 (see Charts 1A and B). In the 1974-80 case, this coincided with gold's steep 1-year decline in-between the two powerful gold bull markets in the 70s. And in both cases, the weakness in gold shares and gold coincided with recession pressures at that time. But once this ended, gold rose strongly and it remained much stronger than gold shares, even though gold shares were rising too. We're not saying today's gold share weakness will take the same form, but if it's similar, this could be a first sign of caution that gold's bull market may be temporarily interrupted before it heads higher. This is only a possibility but it's something we're watching, especially since we're now seeing some signs of an economic slowdown. The 1996-2001 period was different. It was the worst and last phase of the 20 year old bear market and gold shares were hit the most when the internet revolution swept the land. For now, gold shares will likely remain weaker than gold and we'll watch the key gold numbers to keep us on track. GOLD TIMING For now, gold is in an intermediate B decline but it will stay bullish and the major trend will remain up as long as gold holds above its 65-week moving average, which identifies the major uptrend, at $415. And since the B decline appears to be near an end, a C rise may soon be getting started. That'll be reinforced if gold now stays above $415 and then rises and stays above $425. Silver is looking good and gold shares have been rebounding over the past couple of weeks. Could they be leading gold up into the next C rise? That may be and so far, so good. On the downside, however, it'll be a different story if gold closes and stays below $415. In that case, the rise since 2001 would be turning down indicating gold's bull market will likely be temporarily interrupted. In other words, a situation similar to what happened in 1975-76 could then unfold. We'll soon see how this unfolds and since we're at the moment of truth, we should know soon. Mary Anne & Pamela Aden For more information, go to http://www.adenforecast.com/ or http://www.goldchartsrus.net/ 321gold Inc |