.
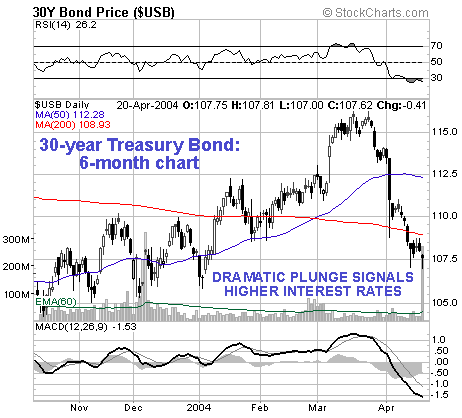
Broad Market Crash and Collateral Effect on Precious Metal StocksClive Maund A critical breakdown has occurred across the gold sector. Yesterday, the HUI plunged, violating crucial support at first the 200-day moving average and then the support at the 200 level. Many stocks crashed down through support levels that I had earlier indicated must hold, in a Marketwatch article on the 11th April, to maintain any prospect of an advance. It was no coincidence that the general market went into a nosedive later in the session, as what we are witnessing here is the start of a stampede out of any freely traded assets that can decline in value. The reason for this is the sudden and terrifying realization that the Indian Summer of seemingly endless low interest rates is about to end. This would not be so bad were it not for the fact that debt is at extreme levels across every strata of US society - personal debt, corporate debt and Federal debt are at levels which can fairly be regarded as insane and catastrophic. In the face of rising rates debtors have good reason to break out in a cold sweat - they are so highly leveraged that any significant rise in rates will crush them. They are now starting to scramble to reduce debt as fast as possible and are selling assets to raise the wherewithal to buy the dollars to pay off the debt - hence the recent and increasing support for the US dollar. To understand the implications of what is about to happen, we'll start by looking at the bond market. The chart for the 30-year Treasury bond shows an ugly plunge, the drop on 2nd April being, I believe, the largest single one-day drop for about 8 years. The other bond and note charts look similar. The steepness of this plunge implies much lower levels to come, regardless of interim rallies to alleviate an oversold condition. What this means is significantly higher interest rates.
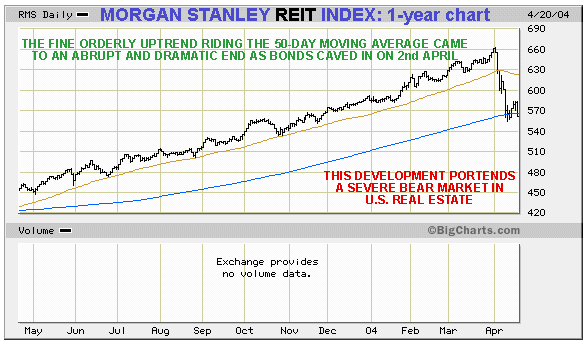
Higher interest rates will be a bombshell to the Real Estate market, which is why the Real Estate Investment Trusts (REITS) have plunged over the past couple of weeks, signalling that the real estate market bubble, which thanks to refinancing has had the afterburners on for a long time now, is about to go "POP!"
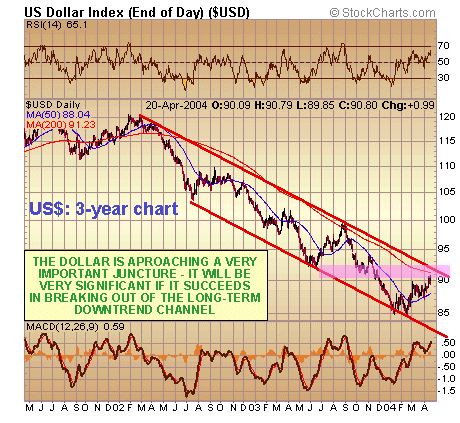
The dollar is continuing to strengthen as the "greenback buyback" for the purpose of paying of paying down debt gathers pace, and it is also being bolstered by the scent of higher rates. A major bullish development for the dollar will be the breaking of the long-term downtrend channel in force since the bear market began.
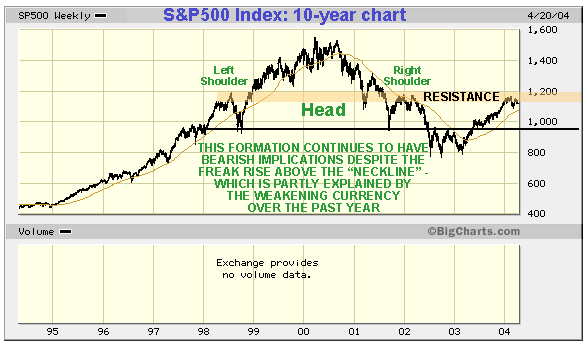
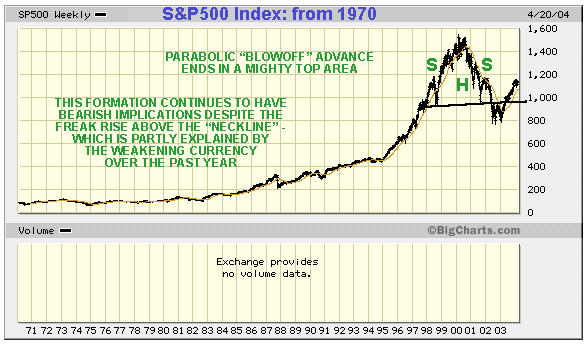
We'll now turn our attention to the general stockmarket, which is teetering on the edge of an abyss. As they have just engaged in a window dressing exercise with the Dow Jones Industrials index by swapping three more lively stocks for tired ones, we'll circumvent this chicanery by looking at the S&P500, which, in any case, has to be a far more accurate representation of the market. On the 10-year chart for the S&P 500 we can see the huge Head-and-Shoulders top that formed between 1998 and 2002, the normal consequences of which did not play out, due to the extraordinary policies of the financial authorities, who adopted "party now pay later" fiscal policies, everything being contrived for the purpose of short-term expediency and gain. What this means is that the normal corrective processes were prevented from playing themselves out, and the corrective pressures have now built up to an explosive extreme - the thing is going to blow and there's absolutely nothing they can do to stop it. They've dropped rates to the basement, flooded the market with liquidity, borrowed until they can borrow no more, created a derivatives pyramid that reaches to the moon, bled foreigners white, and got the hapless homeowners to cash out the equity in their homes and even come up with a half-baked scheme to go to Mars. Hence we are going to see the implications of that Head-and-Shoulders top play themselves out after all, but, thanks to the procrastination, it's going to be far worse. The S&P 500 may not look that toppy to the untrained eye on the 10-year chart, so I also present a chart going way back to 1970 to assist comprehension - you ought to get the picture when you look at this.
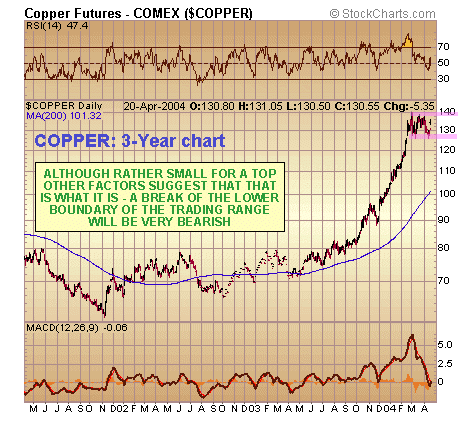
There is the real danger that the commodities boom will turn to bust, due to the "dash for cash" and the prospect of a recession/depression with inflationary forces quickly being overrun by the forces of deflation, and the consequent drop in industrial demand. Although copper has not yet broken down from what looks like a potential top area, the giant Freeport McMoran, a major copper producer, has just crashed support at $35, an ominous sign. I can certainly understand Mr Friedland hastening to sell that big Ivanhoe Mining copper prospect in Mongolia - and I wish him "God's speed".
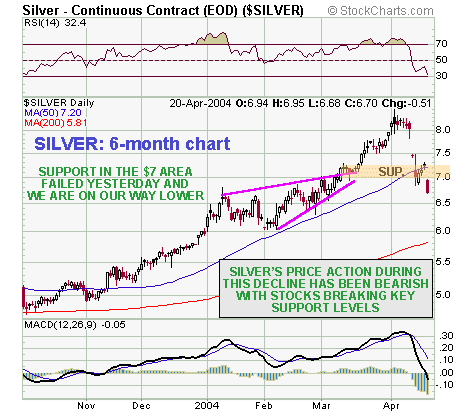
The ugly nature of the sudden plunge in silver a week or so ago and its continuing weakness has serious implications. In the kind of environment that we are moving into, silver is likely to be treated as a commodity, rather than a precious metal, at least in the earlier stages of the general meltdown. The big silver stocks have already crashed key support levels and are plunging precipitously. Silver stock investors are "voting with their feet".
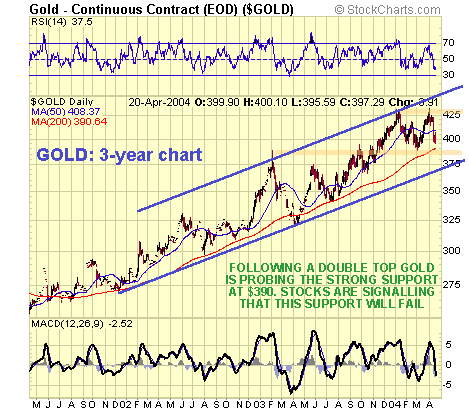
In the impending "great liquidation" phase even gold may find itself being sold off as if it is a commodity. The action in the stocks that are now crashing key support levels, suggests that the $390 support is likely to fail soon leading to a test of the long-term uptrend currently around $375.
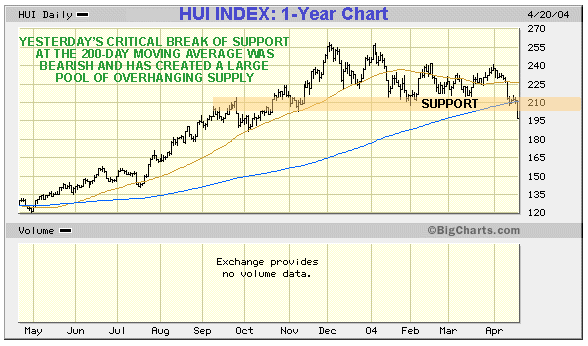
There was an ugly breakdown in the major gold indices yesterday, with the HUI plunging below critical support at the 200-day moving average. This is a decidedly bearish development, and as the index goes lower, so the large body of buyers above the 200 level from last October will create a ceiling of overhanging supply that will inhibit subsequent attempts at advance.
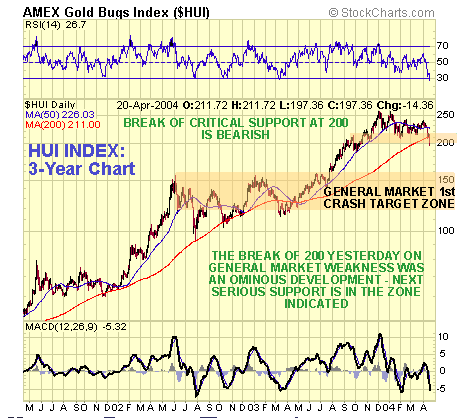
On the 3-year chart we can see the first "crash target zone" which the index is likely to fall to as the general market caves in. I say first because the extent of the decline will be dependant on the severity of the general market collapse.
Many gold stocks broke below critical support levels yesterday, the importance of these breakdowns being underlined by the simultaneous failure in the case of many stocks of their 200-day moving averages. The big silvers had already plunged below key support levels last week, although most of them were riding way above their 200-day moving averages. Hecla was an exception, which managed to break both key support and its 200-day moving average. A selection of (mainly) the
larger gold and silver stock annotated charts follow for subscribers
with a follow-up article focusing on strategies. Visit his
website at clivemaund.com. |

