|
Financial
Market Update
The Financial
Puzzle
Edward Gofsky
May 26, 2004
The last few months in the financial markets have provided an
array of cross currents to bubble up and potentially change the
course of the stock, bond, and economic landscape. I would like
to start off by talking about the stock market first and then
I will move on to talk about interest rates, the housing market,
oil, and the precious metals.
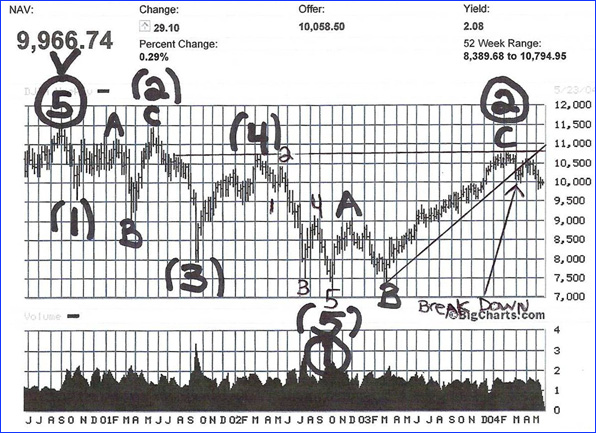
As I talked about in my last essay it looks like wave 2 of this
bear market rally had topped back in Feb/March 04. The DJIA hit
a high of 10750 and is now around the 9900 area, down over 700
points. All three indexes, the DJIA, NASDAQ and the S&P 500
have topped and are now in a 3rd wave decline going into 2005
and probably bottoming in the fall of 2006, which seems to correspond
to the 4 year cycle and the presidential cycle.
There are many
reasons to believe the bear is back, to seek vengeance on the
naïve and undereducated market participants, who have been
fooled and brainwashed by the perma bulls, CNBC and other sources
paid by wall street firms to help the firms bring in more trading
commissions by getting the public excited to buy and more specifically
to trade stocks all the time 24/7.
Obviously the first reason for a bear market resurrection is
valuation. As of may 1, 2004 the DJIA had a P.E OF 24.7 and a
dividend yield of 1.99%. The S&P 500 had a P.E of 24.9 and
a yield of 1.68%. And the NASDAQ 100 had a P.E of 38.7 and no
yield because most of the stocks in the NASDAQ 100 do not pay
any dividends. These are bubble-like valuations to say
the least, these numbers are more indicative of a top and NOT
of a bottom or the start of a new secular bull in general stocks.
Every bear market bottom of the last 100 years has ended with
a P.E under 10 and a dividend yield over 6%. We are definitely
a long way away from those types of numbers! Even if you give
the DJIA a P.E of 14, which is the historical fair value for
that index, you come up with a price level of 5796 which is well
below the Oct 2002 bottom and a very long way away from where
we are today.
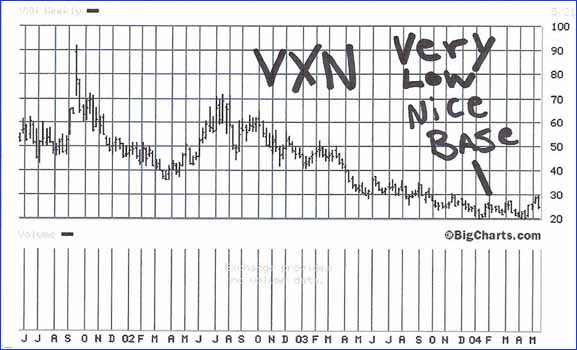
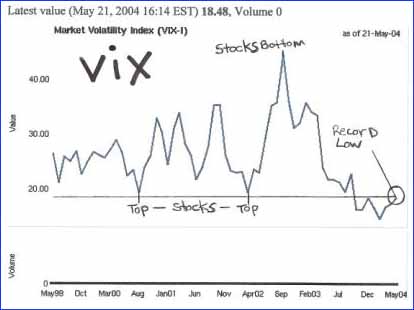
The VIX and the VXN are a measure of investor sentiment. Both
of these indicators are at multi-year lows. This shows that investors
are willing to take risks in the market and it also shows
little if any fear. Readings this low have always been the precursor
to a new bear market.
The 4 year
cycle
I love studying market cycles, they simply fascinate me! Going
back 100 years the DJIA seems to put in a bottom on average every
4 years (62, 66, 70, 74, 78, 82, 86, 90, 94, 98, 02, 06, etc)
it's never exactly 4 years to the day but if you average it all
out it comes out to 4.08 years according to the chart in my book
"The encyclopedia of Technical Market Indicators" page
182. So the Oct 2002 low was the last 4 year cycle bottom as
predicted and the next major bottom should occur in the fall
of 2006. The rallies off the 4 year cycle bottoms seem to last
about 18 months or so, so the Feb/Mar 2004 highs in the 3 major
indexes, in my opinion, were the highs in this current cycle
and we will see a decline with small bear rallies all the way
until the next 4 year cycle bottom in 2006.
The
Presidential Cycle
This cycle is very similar to the above mentioned 4 year cycle
in that each president's terms are only 4 years long. This cycle
has importance and is not very hard to understand. The theory
of this cycle is that the current president will always put forth
the most painful and economically unhealthy monetary and fiscal
policies early on in the first 2 years of his new term, and then
come right back an try to get re-elected by putting forth the
most helpful and stimulated policies in the last 2 years leading
up to the election. This was certainly true this time around
as Bush JR has pulled out all the stops both fiscally and monetarily
in the last year and a half to help him push up the economy just
in time for the Nov 2004 election.
The closer we get to the Nov elections the more tense it will
get in all markets. Especially as some political watchers are
looking for some type of Spain event occurring sometime around
election time. If you would have followed this cycle in 2000
you would have sold all of your stocks once Bush was sworn in,
and bought back in just after the Oct 2002 bottom, which seems
to correlate with the 4 year cycle above.
So as of today you would want to start selling all of your general
stocks (like DJIA ETFs) if you have not already, and wait 2 years
after the fall 2004 elections which coincidentally would give
you a fall 2006 buy signal matching the 4 year cycle above.
Rising
Interests Rates
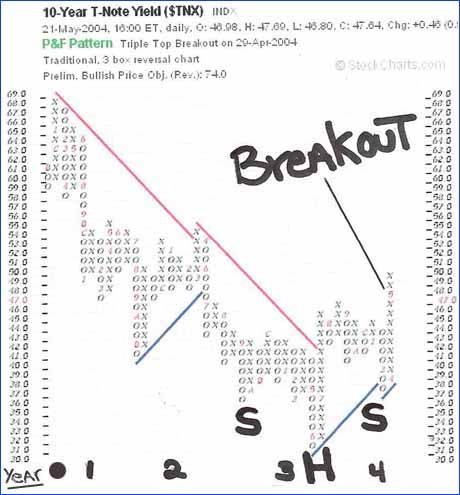
As most people in the markets watch the FED and Alan Greenspan
for magical answers to when rates will rise, I simply look at
the yield on the 10 year bond; this tells me all I need to know.
As you can see from the chart below, the yield on the 10 year
has created a text book perfect head and shoulders reversal
pattern on the P&F chart, one of the most reliable patterns
in the world of technical analysis. As you can see from the chart
the downtrend line from 2000 has been broken and the era of decades
low interest rates are over. This is not at all bullish for the
overall stock market as rising rates will hurt companies'
profits and their ability to handle their debt payments as more
money from their smaller profits has to service the rising cost
of their outstanding debt.
All an investor
needs to look at when it comes to the fed and their record in
rising rate environments is to look at what happened in the 1990's:
the peso crisis, Asia meltdown, Russian collapse, LTCM, 2000
tech implosion, Ect. With the historical amount of debt in all
aspects of the U.S economy, from the man on the street, to the
companies that sell the goods and provide the services, to the
government itself, the level of debt and of derivatives is simply
frightening.
There is no way this is going to end peacefully as simply too
much debt has been taken on by everybody, so even a small increase
in rates will bring to the forefront problems that most investors
and economists can not even imagine today. As Ike Iossif said
on a recent radio
show
with Jim Puplava and Alan M. Newman "It will only take a
rise in rates of 1% to destroy the bond carry trade."
(Borrow short Buy long) This one incident - the destruction of
the bond carry trade will be enough in my own opinion to really
destabilize the whole financial system, and believe me, the fed
knows it!
The battle over inflation or deflation is hardly over but as
of today it seems that the bond traders can see inflation coming
and don't really believe the words coming from the likes of Greenspan
and his cronies at the Fed. The bond vigilantes are demanding
higher rates to compensate for the inflation they see coming
by way of the Feds printing press and helicopter drops.
I am in the camp of investors that believes the Fed will do everything
in its power to stop deflation, even if it means printing dollar
bills and dropping them from helicopters. To the Fed and the
White House a repeat of the 1930's is simply out of the question,
it is downright unacceptable. But the policy of printing
unlimited dollars instead of raising taxes or cutting government
spending will only bring about rapid inflation, and so the Fed
in their own horror trying to stop a repeat of the 1930's may
well create a situation similar to what Germany experienced in
the 1920's "Hyperinflation". Either way, rising rates
and the current Fed policies are not good for the general stock
market going into 2005.
To quote John
Myers a contributor to the Daily Reckoning, he says so eloquently
that:
"The long
and short of it is that credit will continue to be expanded in
this country until no more borrowers can be found. Then, when
borrowing dries up, the government will become the borrower-of-last-resort,
the Fed monetizing all the government's excess borrowing or budget
deficits. This monetary inflation virtually guarantees a bull
market in gold, silver and commodities."
Keep printing,
Dr. Greenspan, keep printing!
Rising
Oil Prices
As most investors know oil just closed above $41 a barrel for
the first time since the first gulf war. This is very bad for
the stock market and the economy (except oil and gas stocks).
There are a lot of people that think this rise in oil is only
temporary and that this short term phenomenon will fall back
to the low 30's. But I would like to share with you some charts
that would tell a different story, a story of much higher prices
for oil going into 05/06.
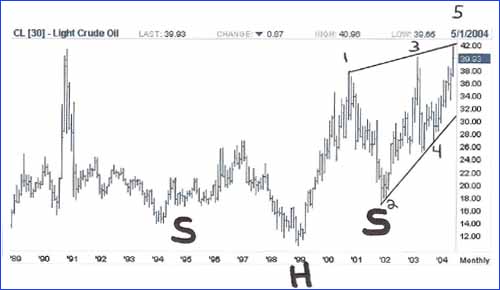
On the first chart you can see a very nice upward sloping head
and shoulders pattern that started to form in 1993. The recent
breakout over $40 was an extremely bullish event from a technical
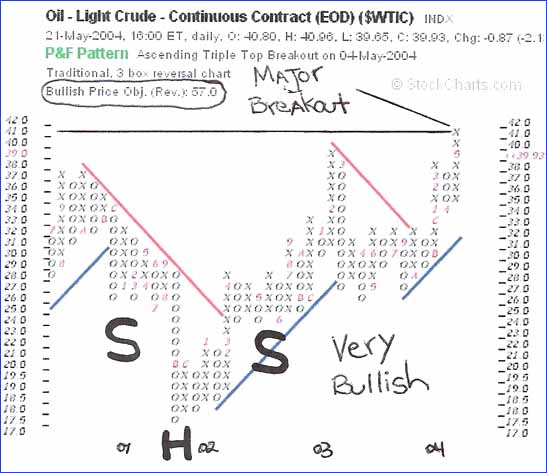
sense. The next chart is a point and figure chart of the oil
price over the last few years; you can clearly see the breakout
on this chart. The price target on the P&F chart is $57 which
if achieved would simply rock the markets worldwide.
It will be
very important to keep an eye on the price of oil because any
shock like a terrorist attack or a massive oil spill will cause
the price to sky rocket. The situation in the Middle East is
akin to a bunch of crazy zealots running around the world's biggest
gas station tossing around lit matches. The whole situation of
rising oil and rising rates and yields brings a close parallel
to the 1970's when rising oil prices and rising bond yields (falling
bond prices) caused gold and silver to explode into record prices.
Gold
And Silver
As anyone who invests in gold and silver knows the last few months
have been tough. The bull market in both metals has definitely
taken a breather, but was the pull back a surprise? I don't think
so! And I will tell you why. First everyone knows that bull markets
ebb and flow, they go up and down, but if you follow the charts
and you can recognize the pattern it makes investing much more
fun and rewarding not to mention less stressful.
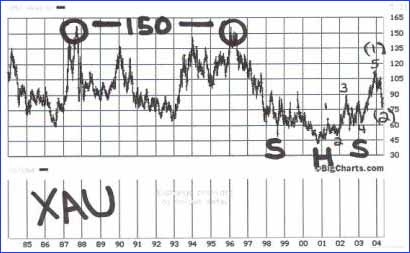
The recent top in the HUI and the XAU gold indexes were nothing
more than the wave (1) top of a (5) wave pattern. (For a full
detailed analysis of the Elliott Wave Theory please read the
classic and most recognized book on EWT "The Elliot Wave
Principal" by Frost and Prechter. As you can see from
the chart below there is a clear 5 wave pattern in both the XAU
and the HUI. As anyone who is familiar with EWT knows, the wave
patterns are fractal in nature, meaning that one set of Elliott
waves are just a pattern in a much larger wave at a higher degree
of trend.
So as I have been seeing panic selling in the last few weeks/months,
I just sit back and smile as I wait for the wave (2) bottom and
the glorious wave (3) rally to new highs going into 2005 and
2006. (A break of 113 on the XAU and a break of 256 on the HUI
would signal the start of wave (3).
I believe the final 5th wave in gold and gold shares (which will
be the frothy mania) won't occur until later this decade, when
gold hits $1000 and silver is over $50. I don't trade in and
out everyday and let my precious capital get killed by commissions
and slippage, I just look for clear long term wave or classical
technical patterns to develop and then invest in those sectors
with those patterns and sit tight and wait for the patterns to
complete themselves.
As you can see from the long term chart of the XAU, this massive
ultra bullish head and shoulders reversal pattern has the 150
level written all over it! I will personally just wait and let
this pattern complete it's self and then SELL and take my profits
(which is the most important aspect of investing), please read
the two books "It's when you sell that counts" and
"when to sell" to get a good handle on when
to sell, and why it is the most important skill to acquire in
investing and trading.
So for all
you fellow gold and silver investors out there that are getting
stressed out I say to you, calm down, relax and just let the
patterns do what they will do, and in the case of the XAU what
they will do is go to the 150 level in 2005 or 2006.
Before I finish up this part on gold and silver I want to clear
something up for the new gold and silver investors out there.
Please don't be fooled and believe the lies spewed out of CNBC
and the people trying to get you to sell your gold and silver
and gold and silver stocks to them at a wave (2) bottom so they
themselves can take them from you, leaving you naked,
so they themselves can enjoy the bounty of a magical wave (3)
rally.
Don't listen to people who say that rising rates will hurt gold
and silver, because all you have to do is look at this chart
below of the yield on the 10 year bond going back to 1960. This
chart tells you all you need to know, when yields rose throughout
the 1970's so did gold and silver and when yields fell for 20
years from around 1982 to present gold and silver have been down.
It has only been since 2001 that gold and silver have really
rallied probably anticipating higher rates into the future, and
here we are in that future and all you hear about is higher bond
yields and higher fed funds rates.
So please look at this chart and notice that when the yield on
the 10 year bond was over 10% in 1980 where was the price of
gold and silver? $850 gold and $50 silver, and what is the yield
on the 10 year bond toady? it is only 4.76%. So in my own analysis,
rising rates and bond yields are very bullish for gold and silver,
so the coming rate increases by the fed to fight inflation and
the bond vigilantes is only the beginning of the bull market
in the precious metals.

Stalking
the Housing Bubble
I am a ferocious reader of books, newspapers, and many financial
newsletters. In the past few months while I have been reading
my financial newspapers I have been cutting out and keeping all
the articles about the big housing boom. I have studied and read
about most of the financial manias of the past 500 years from
the john law scandal of 1720 to the crash of 1929 to the bubble
of the late 1960's to the gold and silver bubble of the 1970's
and most recently, the tech bubble of the late 1990's.
Most manias (and it does not matter which time frame you are
using, because all manias have the same underlying characteristics)
that are talked about in the financial media have a few choice
words that are used over and over again to describe what is going
on in the market that has all the attention of the mass public,
be it gold, tech stocks, nifty fifty stocks, real estate, baseball
cards, fine art, or radio stocks. Below I will list some of the
most recent headlines from my local newspapers around my home
town of Vancouver Canada (The most expensive place to live in
all of Canada!).
In all the manias I have studied, the words most used in the
press are MANIA, BOOM, HOT, FEVER, RECORD, HIGH, and SKYROCKET.
In the biggest manias some of the words are put together!
Here are some of the headlines from my local papers, you be the
judge and ask yourself, is this a real mania? because it sure
looks and sounds like one to me, this will only end badly in
the coming years as rates on mortgages rise:
CONDO-MANIA
Vancouver Province, Sunday, Feb 29, 2004. Front page story!
CONDO FEVER GETS EVEN HOTTER
The Vancouver Sun, Wednesday, May 5, 2004
URBAN CONDO BOOM
HITS RICHMOND
The Richmond Review, Weekend edition, May 15-16, 2004
VANCOUVER'S CONDO MARKET KEEPS GETTING HOTTER
The Vancouver Sun, Saturday, April 3, 2004
MARCH CONDO SALES BIGGEST ON RECORD
The Vancouver Sun, Saturday, April 3, 2004
CONDO SALES SKYROCKET
Vancouver Province, Monday, April 5, 2004
I will close
this part of my essay with a small article that just recently
came out and was totally under the radar screen of most homeowners
and investors. If you have decided that this is a full blown
mania and that home prices will fall over the coming decade,
what will the implications of this article mean for most investors
and the economy when rates rise much higher over the next decade?
I will leave it up to you!
HOMEOWNERS
DREW $29 BILLION IN HOME EQUITY
Canadian homeowners refinancing their mortgages, mostly as home
equity loans and lines of credit, are creating an annual impact
equal to the creation of one million new jobs, according to a
study by CIBC world markets.
Canadians took $29 billion from home equity from 2002 to 2003,
the report states.
"Canadians have been refinancing their mortgages at a pace
never seen before," said Benjamin Tal, senior economist,
CIBC world markets. The CIBC says refinancing put $36 billion
of extra purchasing power in the hands of mortgage holders. "This
is equivalent to the annual income from one million new jobs
being created."
When mortgage holders refinance, about one in three increases
their mortgage amount by $28,000, leading to an $18 billion increase
in total mortgages outstanding in the economy, according to Tal.
Given current mortgage rates, the report estimates that almost
a quarter of mortgage holders can still benefit from refinancing
their mortgage, adding to the 50 per cent whom already have.
Homeowners draw equity from their homes for home renovations,
other real estate investments, education and a myriad of other
reasons.
Final Comments
In closing this essay I would like to summarize that when you
put all of these pieces of the financial puzzle together, it
is very bearish for the general stock market, bearish for bonds,
bearish for real estate, bullish for precious metals and bullish
for oil.
There is simply too much risk in this market for anyone to be
fully invested. I would highly recommend that investors of all
ages start to raise their cash positions and start to buy some
deeply oversold gold and silver stocks before the wave
(3) rally going into 05/06 in the HUI and the XAU.
Get ready for a very violent return of the bear in the DJIA,
NASDAQ, and S&P 500, I am sure the bear did not appreciate
getting tied up and tossed off the boat by the bull a few weeks
ago! (Reference to the front cover of Barron's soon to be remembered
as one of the most historical sell signals of all time!) So I
can imagine that he is a little ticked off, the bear will come
back and slaughter all those who disrespected and mocked him
over the next 2 years into 2006 in an "all-you-can-eat
perma-bull massacre."
The last thing that I want to share with all of you is this very
important message.
I love studying Elliott wave patterns, classical technical patterns,
cycles, gold and silver, call and put options and many other
sophisticated ways of investing or trying to predict the future
trends of price action in the markets.
But I strongly encourage all of you not to forget the most basic
laws of financial planning. I encourage all of you to always
have a solid financial plan and to always follow some basic but
very important rules about how to get rich slowly.
Everyone today wants to get rich quickly, like buying a tech
stock at $1 and riding it to glorious profits and selling out
at $50. That's great and all, but these types of investments
should only be implemented after a solid financial base has been
built.
I have been studying financial planning since I was 17 and I
really like to consider that my specialty. So before I go today
I want to share some very basic strategies for building a solid
financial base for a secure future.
• Self Education: Anyone
who wants to do well in the financial markets needs to do a lot
of reading. Every investor needs to make it a priority to teach
themselves the fine art of financial planning and proper money
management. I advise people to not watch CNBC because they are
paid by Wall Street to only talk about buying stocks and how
great the economy is, you get a biased opinion in other words...
Every investor needs to think independently.
• Owning your own home:
Paying
off your mortgage every month is a great way for saving and asset
building.
• Start saving and investing as early as possible, so you
build the habit and take advantage of the compounding of your
money.
• If your goal is to become wealthy, you must make some
important choices such as, deferral and doing without, and putting
money away with considerable frequency.
• You must put at least a small portion of your
savings into investments that can not be printed up by the printing
press. Buy physical gold and silver coins and bars.
• Stay out of debt: Only own 1 credit card.
• Live well below your annual income.
• Create multiple streams of income (earned income, passive
income, portfolio income).
• You must live by the commandment of living modestly and
saving regularly.
• You must be a saver and not a spender.
• Keep consumption to a minimum.
• Read all the books by author Napoleon Hill, he has written
some of the best books ever on how to use your brain to attract
things and people towards you, mainly money and financial well
being. I highly recommend his first book "Think and grow
rich" it just might change your life!
Every investor needs to tailor a financial plan for their own
individual circumstances, but anyone can follow a few of the
above strategies.
Building a solid financial foundation is the best thing any investors
can do for themselves.
I love getting
feedback from all my readers around the world, so please drop
me a line if you have any questions or comments.
Edward Gofsky
May 26, 2004
Email: Eddy_gofsky@yahoo.com
Edward Gofsky
lives in Vancouver B.C, Canada where he studies Elliott Wave
Theory and Classical Technical Analysis.
Copyright ©2004
Edward Gofsky. All Rights Reserved.
______________
321gold Inc

|
