| |||
The GINI is Coming Out of the BottleTXRogers I want to continue highlighting a theme that I use in guiding my investment choices. In junior resource companies such as Novo Resources, that have a good chance of growing into a significant business. As a result, I stumbled across a piece written by a gentleman named Virgilio Malagon from the Universidad del Caribe (in the Dominican Republic). His explanation of the GINI Coefficient saves me the effort:
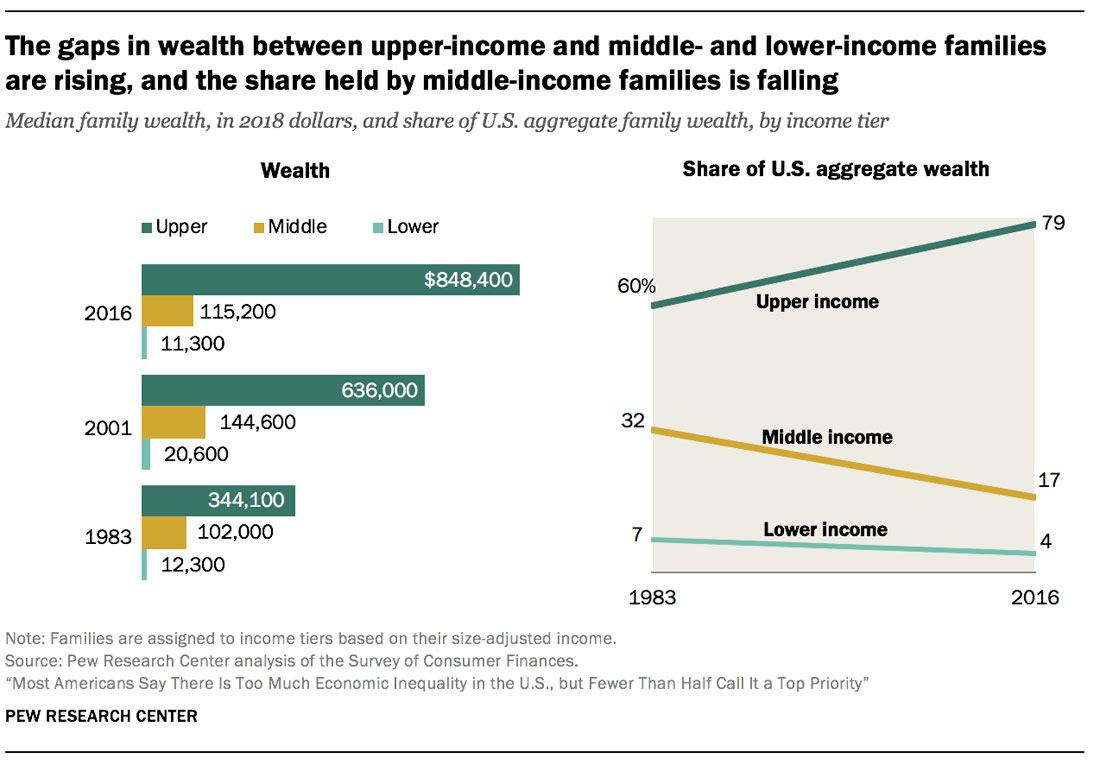
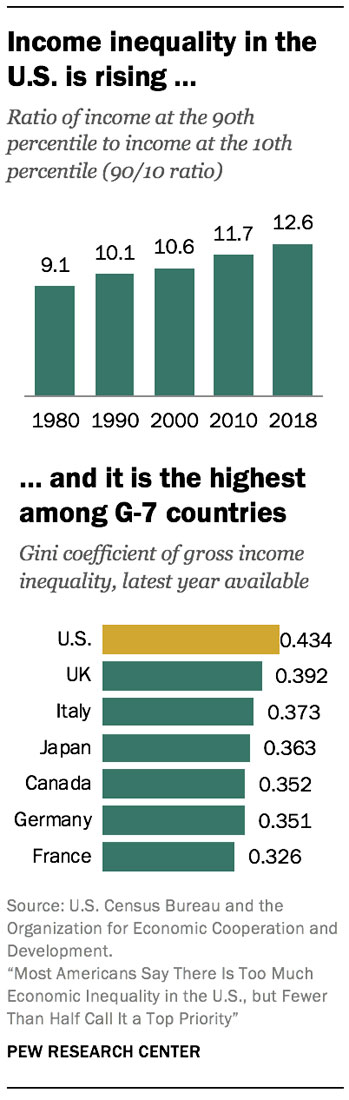
This GINI Coefficient is very important on many levels. It has a direct impact on this investment, the jurisdiction where the company business is conducted, the jurisdiction of your own personal residence, the price of gold, and many things we are witnessing in our world today. Throughout the developed nations in the West, barely 10 years have passed since the end of the Great Recession of 2009, and things have appeared to be doing well on several fronts up until the beginning of 2020. The labor market was reported as being on a job-creating streak that has rung up more than 110 months straight of employment growth, a record for the post-World War II era. Some question this "boom", but that has been the narrative since 2009. The claims come from the US. And it is the most relevant because the United States, simply put, represents the largest economy in the West and “ground zero” of the current Global Financial Empire. The US unemployment rate in November 2019 was 3.5%, a level not seen since the 1960s. Gains on the jobs front are also reflected in household incomes, which have rebounded in recent years. But these appearances have been deceiving because they masked a truly destructive phenomenon. During the period leading up to the Covid-19 crisis, household incomes grew only modestly in this century, and overall household wealth has not returned to its 2009 pre-recession level. Economic inequality, whether measured through the gaps in income or wealth between richer and poorer households, continued to widen. The growth in income in recent decades has tilted to upper-income households. At the same time, the U.S. middle class, which once comprised the clear majority of Americans, shrank. Thus, a greater share of the nation’s aggregate income is now going to upper-income households and the share going to middle- and lower-income households is falling. The share of American adults who live in middle-income households has decreased from 61% in 1971 to 51% in 2019. This downsizing has proceeded slowly but surely since 1971, with each decade thereafter typically ending with a smaller share of adults living in middle-income households than at the beginning of the decade. (Click on images to enlarge) Source: www.pewsocialtrends.org Not only is income inequality rising in the U.S., it is higher than in other advanced economies. The Gini coefficient in the U.S. stood at 0.434 in 2017, according to the Organization for Economic Cooperation and Development (OECD). Source: www.pewsocialtrends.org This is higher than in any other of the G-7 countries. The current GINI Coefficient for each country can be found at the link: Which brings us to the current Covid-19 crisis: Three countries in North and South America – the United States, Brazil, and Mexico – account for just under half (46%) of the world’s reported COVID-19 deaths, yet they contain only 8.6% of the world’s population. Some 60% of Europe’s deaths are concentrated in just three countries – Italy, Spain, and the United Kingdom – which account for 38% of Europe’s population. There were many fewer deaths and lower death rates in most of Northern and Central Europe. Several factors determine a country’s COVID-19 death rate: the quality of political leadership, the coherence of the government’s response, the availability of hospital beds, the extent of international travel, and the population’s age structure. Yet one deep structural characteristic seems to be shaping the role of these factors: countries’ income and wealth distribution. The US, Brazil, and Mexico have very high income and wealth inequality. The US has the highest Gini coefficient among the advanced economies, while Brazil and Mexico are among the world’s most unequal countries. In Europe, Italy, Spain, and the UK – with Gini scores of 31.9, 35.9, and 32.4, respectively – are more unequal than their northern and eastern counterparts, such as Finland (27.2), Norway (26.8), Denmark (29.0), Austria (30.5), Poland (30.8), and Hungary (28.2). The correlation of death rates per million and income inequality is far from perfect; other factors matter a lot. France’s inequality is on par with Germany’s, but its COVID-19 death rate is significantly higher. The death rate in relatively egalitarian Sweden is significantly higher than in its neighbors, because Sweden decided to keep its social distancing policies voluntary rather than mandatory. Relatively egalitarian Belgium was battered with very high reported death rates, owing partly to the authorities’ decision to report probable as well as confirmed COVID-19 deaths. High income inequality is a social scourge in many ways, leading to worse overall health conditions, which significantly increases vulnerability to COVID-19 deaths. Moreover, higher inequality leads to lower social cohesion, less social trust, and more political polarization, all of which negatively affect governments’ ability and readiness to adopt strong control measures. Higher inequality means a larger proportion of low-income workers must continue their daily lives, even at the risk of infection. More inequality also means more people living in crowded living conditions and therefore unable to shelter safely. And now let’s get to the main point. In our current World Financial Order and US centered monetary system, we can see that the core of “The Empire” is suffering from an increasing polarization of wealth and all the social problems that come with it. It is currently being compounded by a health crisis that exasperates the issues even further. It is very dangerous. As many folks that reside in the effected regions can surely attest. Gold, silver (PMs in general) and their miners are all an essential means to protect your wealth as things continue to deteriorate. And you can measure this deterioration with tools like the GINI Coefficient. Don’t focus so much on the pure accuracy of the coefficient, but more the trend in direction over the last several years. And now that Covid-19 has hit us all. But it’s not enough to simply invest in the general PM sector. Choose wisely where these mines and places of business are located. Try and avoid jumping into an even more intense flame. Australia's GINI Coefficient stands at 30.3 (and Canada's at 32.1). All prime places for a company like Novo to conduct the business of wealth creation and preservation. Tx ### Jul 7, 2020 Disclaimer: Novo Resources Corp is a company engaged in the business of evaluating, acquiring and exploring natural resource properties with a focus on gold. The organization has business interests in the properties located in Australia, Canada and the USA. Its projects include Beatons Creek Property, Talga Projects, Blue Spec Project and many more. It has one reportable operating segment, being the Acquisition and Exploration of Mineral Properties. This article was orginally sources from stockhouse.com. 321gold Ltd |
