Market Bounce Coming
Brian Bloom
Nov 27, 2007
The Dow Jones Industrial Index
is now badly oversold from a technical perspective, and it looks
more likely that the markets will bounce up than "collapse".
Having said this, the most important chart in the array of charts
seems to be the Dow Jones Industrial Index below. (Courtesy Bigcharts.com)
If we focus on the On Balance
Volume chart we see that, since October, there have been a series
of falling bottoms - and about a week ago, the OBV fell to a
new low. This constituted a "sell" signal. Since then
it looks like it wants to rise because the there has been a series
of three rising lows in the last week.
To give you some context, the chart below is the same chart,
but it shows a 12 month period.
Since around May this year,
the OBV has been hovering around the 5-7.5 billion share mark,
and the OBV is now closer to the 5 billion mark.
If you now look at the next chart - which is the same chart dating
back to 1998, you see that the OBV started rising strongly in
mid 2003 - following what is known as a "non confirmation"
by the MACD. In late 2001, the MACD fell to a low when price
fell to a low, but in 2002, when the price fell to a lower
low, the MACD low showed rising lows
Now let's focus on the MACDs
in the three charts.
- Note how the MACD fell to
a lower low in November than in August (in the first chart)
- Note the series of three descending
lows in the MACD in the second chart
- Note, in the last chart, that
the MACD at -500 is far higher than the 2001 low of -1,000.
There is a formation on the
10 year chart above - which is known as a "megaphone"
formation which has been slowly emerging in 2007.
Since about June, there have been three successive rising tops
and also three successive falling bottoms in the price chart.
This is a sign of confusion. The bulls have been increasingly
bullish and the bears have been increasingly bearish.
That's why the On Balance Volume Chart is so important. It tells
you who is winning the war.
The first chart above shows that, during the period when the
megaphone was being formed, on balance, sellers prevailed. There
was less volume changing hands when the three new highs manifested
that there was when the three new lows manifested. Net, Net,
selling pressure has prevailed. Having said this, selling pressure
has been subtle. It does not reflect urgency so much as opportunism.
My interpretation of all of the above is that, with the market
very badly oversold, it might bounce upwards in the very short
term - but this will be a sucker rally. I don't think the market
will rise to new highs.
So far, the above does not show signs of any coming "Panic".
More likely we will see a series of hopeful rallies followed
by a series of agonising falls - with a bias to the downside.
The 11,000 level seems like it will offer significant technical
support, and the 13,000 level now represents resistance.
The days of easy money "day trading" profits are behind
us.
Now let's focus on gold. Does this represent a "safe haven"?
The biggest single issue relating to gold is that it has highly
emotive connotations. This is not an accident of history. There
are significant practical reasons for this, which have nothing
to do with "money" and which are clearly explained
in my novel. These reasons cannot possibly be explained here,
and so we need to cut through all the "theory" and
look at the charts.
The first chart below shows gold relative to the $CCI commodity
index on a weekly basis: (Courtesy stockcharts.com)
This is not an easy chart to
interpret. From a bullish perspective, one could argue that -
since April - there has been the emergence of a "saucer"
formation. If it breaks through the 1.9 level it might scream
upwards relative to commodities.
From a bearish perspective, the MACD looks overbought as does
the RSI.
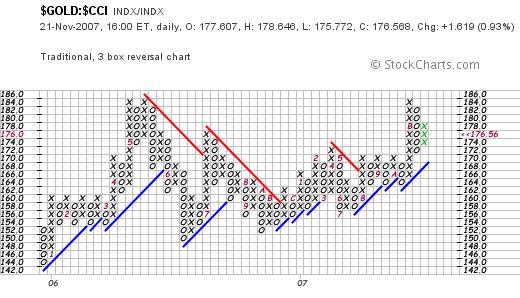
Now, if we look at the daily charts, this is even more confusing:
Here the MACD looks like it
is turning up, as is the RSI. Also, the price chart peaked and
has been "neatly" consolidating as it pulled back to
the 40 day Moving Average line - from which it is now bouncing
up.
The saucer and the double top are clearly seen from the P&F
chart below, and the three green Xs seem to show a healthy sign
that the ratio will at very least consolidate around this level.
If we take a step back and
look at the P&F chart, sensitised for a 3% X 3 box reversal,
we see that a break to new highs will likely be very bullish.
We could see the ratio rising to around 202
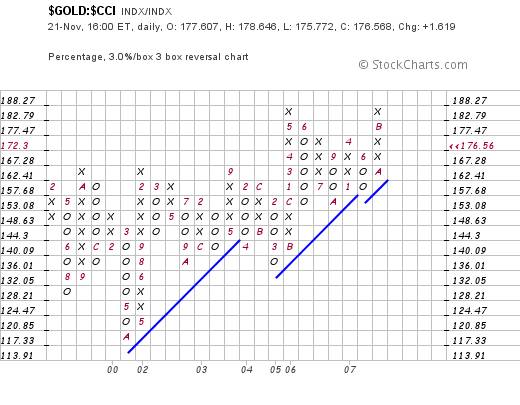
The question is whether this
will arise from an "explosion" in the gold price, or
a fall in the prices of commodities in general.
The chart below is a 2% X 3 box reversal chart of the $CCI commodities
index
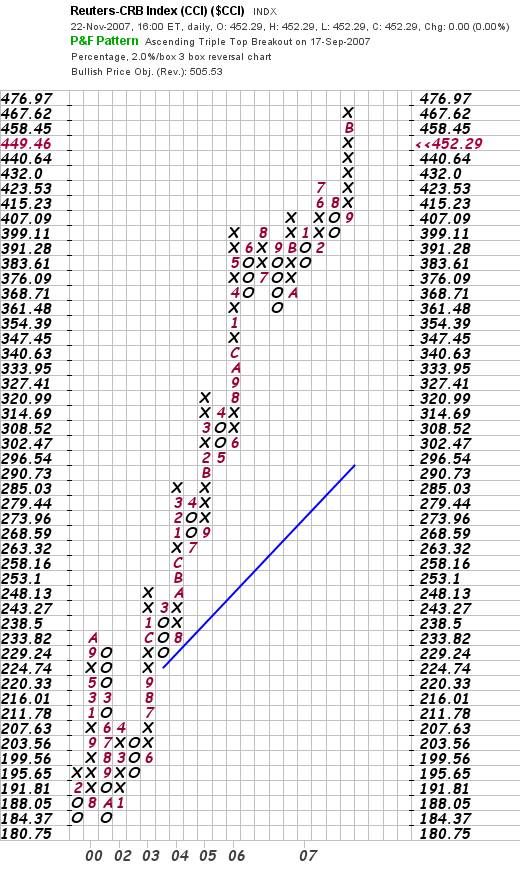
This is hardly a bearish chart
at present, but it might pull back to (say) the 430 level.
It would be easy to argue that "therefore, the market is
expecting inflation, and all commodities should rise, with gold
rising faster than everything else."
This argument is, in my view, too easy. The reason is that if
the market was expecting inflation, the interest rates should
be rising.
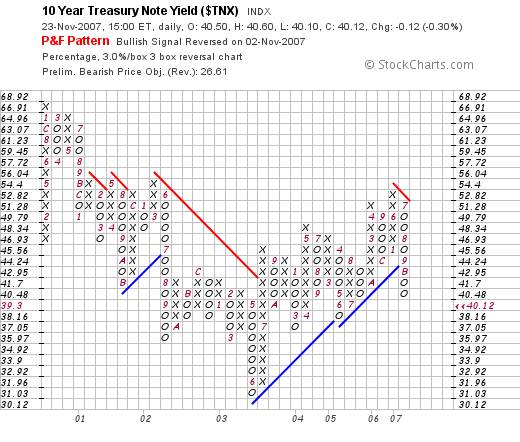
The following chart shows that, contrary to expectations, long
dated yields are falling.
So, with all the above in mind,
where does the argument lead?
Overall Conclusion
It looks like "negativity" is the dominant emotion
in the market, but right now this fear is manifesting more as
caution than fear. Investors are moving to protect themselves.
Some are moving to put their money into hard assets, whilst others
are moving to put theirs into government bonds. If hard assets
become the "flavour of the month" then gold will likely
outperform all the others.
Will there be a market crash? It is possible but, based on the
current technical situation (which might change) I doubt it.
Authors Comment
Why do I doubt it that there will be a market crash?
Technically, the information above is biased slightly to the
negative. It is not (yet) showing signs of panic. Fundamentally,
if the market collapses at this point, it will be a collapse
from which there will be no recovery. We
quite simply cannot afford to allow the markets to collapse.
Having said this, we need to have a reality check here! Because
our testosterone addled politicians cannot think beyond the next
election, the world economy has no fall back to Peak Oil and/or
Coal. If the markets collapse, the debt mountains will implode,
against a background where the industrial "paradigm"
that is required to drive the economy out of the financial quagmire
that will result is not yet in place. The problem with solar
power is that it delivers voltage but not amperage. It cannot
drive machinery except if it is used to recharge batteries, and
our electricity storage technologies are inadequate to that particular
task. Can you imagine an industrial complex with three phase
heavy machinery being driven by solar power? I can't. Solar power
cannot even (practically) deliver sufficient energy to power
the average home with one refrigerator, one TV set and a reverse
cycle air conditioner. It can warm water during the day when
the family is out of the house and it can charge batteries to
allow the low amperage lights to burn at night. That's it. Without
massive non-chemical energy storage capacity, solar power will
never be anything other than a back-up energy system.
Nuclear power might generate electricity, but it has zero capacity
to facilitate "spin-off" technologies of the equivalent
of plastics, textiles, pharmaceuticals, many chemicals and, most
importantly, the internal combustion engine.
Wind powered electricity is a romantic dream. Sure, it works
in areas where there is wind, and that is good. But wind is not
ubiquitous across the planet and wind power also has no capacity
to facilitate spin off technologies. I have no idea how many
motor cars are in the "inventory" around the world,
but I would take a wild stab that the number may be around 300
million or so. It was those 300 million cars (and those that
were manufactured before them) that "drove" the world
economy - the road building, the steel industries, the tyre industry,
the gasoline industry which facilitated their technology, the
insurance and finance industries that were associated therewith.
Even the fast food industry was facilitated by the motor car,
allowing McDonalds family restaurants to pop up along the highways
of the USA. Solar powered motor cars or wind powered motor cars
are not practical. How will we get from point A to point B when
oil has run out? Hydrogen is an energy sink. How will we recharge
"clean", battery operated motor cars? With dirty coal
fired power stations?
So where does that leave us? Are we screwed? The answer is "NO!
WE ARE NOT SCREWED!" There are alternative
electromagnetic technologies which could replace fossil fuels,
but no one is yet prepared to hear that this may be an option.
These technologies are being rejected based on nothing more than
prejudice. There is no theoretical reason (that mainstream physicists
yet understand) why they could work, therefore they are impossible.
"Prejudice" is the biggest obstacle to human progress
because it assumes that all that is known is all that there is
to know.
To overcome prejudice is one reason I wrote Beyond Neanderthal.
It explains these electromagnetic technologies and how they may
generate spin off technologies; how they might clean up the environment
and DRIVE the world economy forward by empowering
every human being on this planet. It also explains how unscrupulous,
power hungry egomaniacs have manipulated the religions of the
world to artificially fabricate the so-called 'Clash of Civilizations.'
When you dig down into the source documents of these religions,
they all say the same things. If you would like to acquire a
copy of this novel - targeted for publication end March 2008
- please register your interest at www.beyondneanderthal.com
Nov 24, 2007
Brian Bloom
website: www.beyondneanderthal.com
email: info@beyondneanderthal.com
Australia
321gold Ltd

|
