|
|||
Dow MegaphoneBrian Bloom The following chart (courtesy stockcharts.com) shows a megaphone formation:  It also shows a sell signal in the MACD, but the RSI is in neutral territory. A 'megaphone' or 'broadening' formation is essentially one which shows higher highs and lower lows. As this defies all logic, it is also a sign of a market which is highly emotional. Typically, this is a bearish formation because it is also a sign of a market spiralling out of control. What sometimes happens is that the megaphone starts to contract from its widest point to form a mirror triangle, and the end result is a "diamond" pattern - which is also typically bearish but, strictly speaking could also be a continuation pattern. At the end of the day, megaphones and diamonds should not be looked at in a vacuum because the analyst tends to filter this type of formation through his own prejudices. The congenital Bear says: "You see, the market is spiralling out of control. Sell!" The congenital Bull says "Ha! This is evidence of a market that is pausing for breath. Buy!" So let's look at some other technical indicators: The following decade long chart of the Dow Jones Industrial Index (courtesy Bigcharts.com) is illuminating: 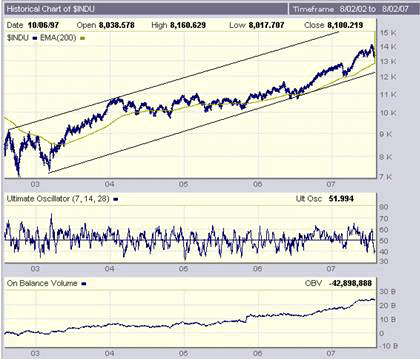 It shows a strongly rising On-Balance-Volume chart, and an oscillator that seems to be reaching towards an oversold position. With the Index itself still above its 200 day MA and still moving within the rising channel, there is no technical indication which would give rise to serious concern. The problem with technical analysis, however, is if you wait for the signal it might be too late to act. Are there any signs that the market may be topping out? The $SPX chart is showing some positive "trading" signs: 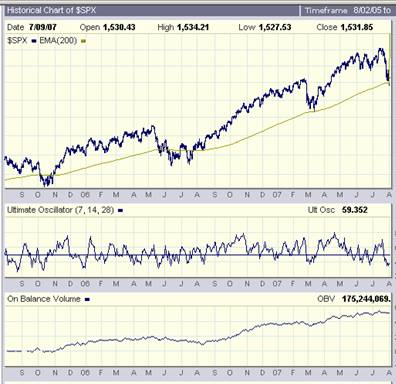 Here the oscillator is in deeper oversold territory even as its 200 day MA remains intact, and its OBV has been tracking sideways. So, on balance, the industrial equities look like they may bounce upwards. What about Gold? The $XAU chart below looks like it is experiencing "healthy" consolidation, having broken up above the third line of a three line fan formation - which is typically bullish: 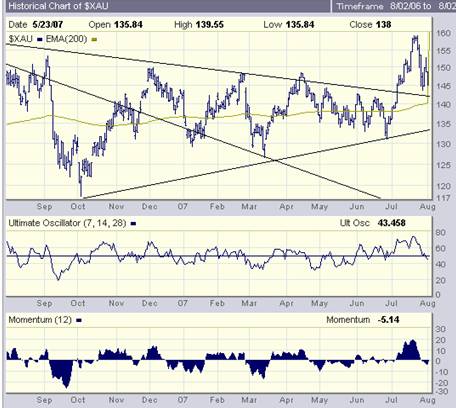 Some further consolidation looks possible. The weekly goldollar index is still looking okay (courtesy decisionpoint.com). It is also consolidating - this time within a triangle, which is more often than not a continuation pattern (but might be a reversal pattern under some circumstances, eg a Primary Trend Reversal) 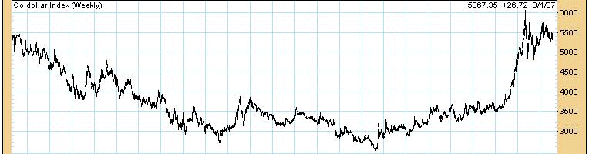 Is there any sign that the Primary trend of the gold price itself looks like it may want to reverse? The short answer, based on the P&F chart below (courtesy stockcharts.com) is "no" 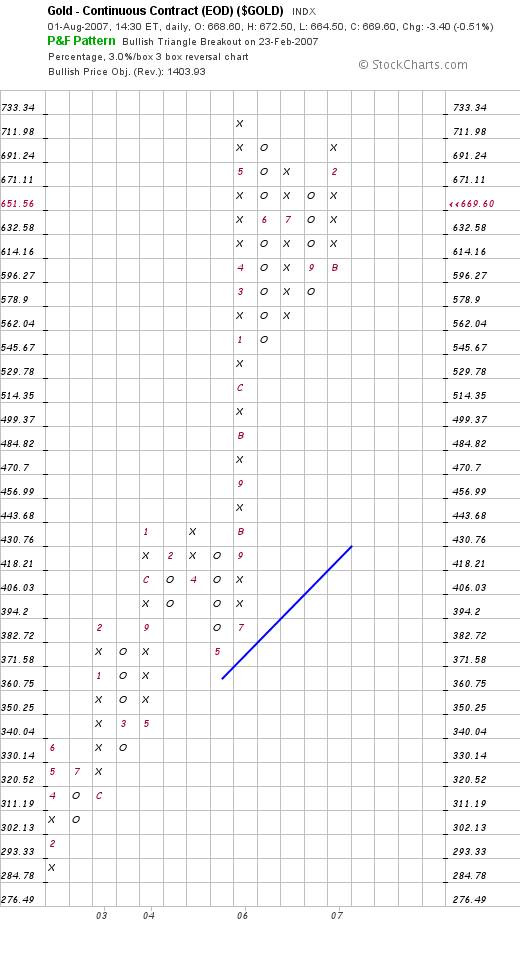 So, what's the appropriate reaction on the part of investors? Unfortunately, this analyst is biased against Industrial Equities at present and has been for some time. I don't see values, and I don't believe that the record profits that were recently being reported by many companies have been real. In my view, inflation numbers are being cooked by the authorities and record profits in dollar terms are not being mirrored by record performance in "volume of transaction" terms. My view is that the rising oil price is causing a slowing of the velocity of money even as it is also driving inflation - facilitated by loose money policies. In my view, we are seeing a Hollywood Film Set. Pretty on the surface, but empty behind. So, bottom line, I have taken a policy decision to stay a thousand miles away from industrial equities - except for special situations. Gold, on the other hand, is a different matter. There I am happy with both the fundamentals and the technicals, and I have decided to hold. However, I have lightened my portfolio to balance it so that gold holdings only represent around 10% of total. My objective in holding gold shares is as an insurance policy against Central Bank screw ups. In the long term, I see gold as an extraordinarily valuable commodity - but this might be ten years away. If the US Dollar Index breaks below 80 I might reconsider so, just for the heck of it, let's look at the US Dollar Index: The P&F chart is a worry, but it seems to be holding at the double bottom for the time being: 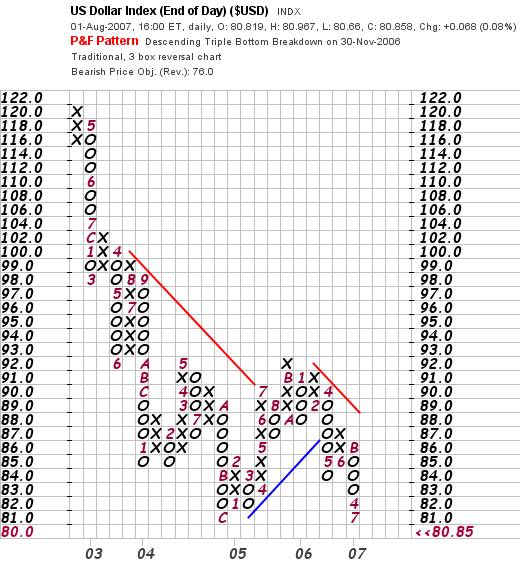 The following chart looks like it has a falling wedge pattern - which is typically "bullish" given that the bottom trendline is falling at a shallower rate than the top trendline 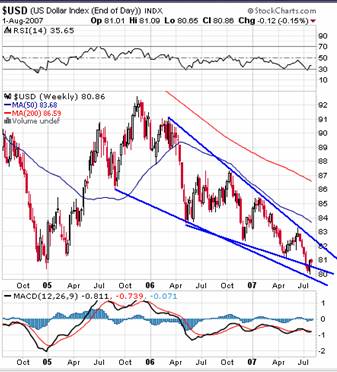 The long dated bond yield also looks like it is in benign territory, just dickering around for the moment. 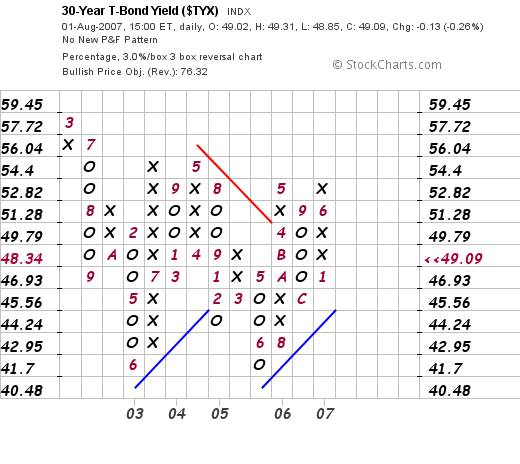 Overall Conclusion Regular readers will be familiar with my view that the markets are ultimately "managed" by the Central Banks. The above charts show no cause to believe that they are losing their control. Although I personally have no appetite for Industrial Shares, there seems to be no cause for serious concern amongst the 'punters' at this stage. Lots of luck to you guys. You're braver than I am. My days of 'dicing with death' are behind me. Gold shares are consolidating and, provided you are not exposed to leverage, there appears to be no cause for major concern here either. Post Script Whilst the above sounds benign, some readers may have been tracking a series I have been writing on the energy markets. If you haven't, I recommend that you do. In that area I am far from relaxed. In my mind, the energy markets are seriously exposed to extremely worrying and growing risks. It is "merely" because the Financial and Currency Markets are being managed that the deterioration in the underlying drivers of the world's economy (the energy markets) is not yet manifesting in the main markets. In my view the financial markets are being held together to keep the playing field level for the US Presidential Elections. But I can "smell" trouble brewing behind the scenes, and the stench is greatest in the energy markets. Frankly, when I read in the New York Times about what Senator Bingaman's Energy Bill contains, my stomach went into a knot. There seems to be panic behind the scenes, and the panic is being barely contained. One sentence has been slipped into the Bill with no discussion whatsoever. That sentence has the capacity to turn the Department of Energy into a monster. They are basically being given a blank cheque to "fix" the energy problems. From what I can see on the surface, the probability that the DOE will spend the money wisely is vanishingly small. The lobby groups are circling like vultures over a dying animal on the prairie. The Nuclear and Coal Industries are holding out their hands for Government to assume up to a hundred billion dollars of unnecessary (contingent) financial risk. That is scary stuff - particularly because it is being structured to be off balance sheet! From my perspective, the DOE is also being given a license to cheat. Is no one being held accountable for anything anymore? Brian Bloom
Beyond Neanderthal Via the medium of its light hearted storyline, it examines how the world has gotten itself into the horrific quagmire of economic and social problems with which we are now faced - and puts forward one possible course of action on which we might embark to dig ourselves out. It may be ordered over the internet via www.beyondneanderthal.com. Or purchased from Amazon. 321gold Ltd |