|
|||
Gold: Where to now?Brian Bloom The past month has required extraordinary attention to be paid to the charts as the gold markets have been approaching a decision point. On June 21st, 2007 this analyst stuck his neck out by calling for an upside break. (See http://www.321gold.com/editorials/bloom/bloom062107.html) So far, it has been a fairly nail biting time, but the call seems to have been reasonable. Now what? Well, let's not get carried away. This can be a humbling business. First, let's look at two of the leaders: Newmont and Barrick. (I chose these two because they are heavyweights, and also because their charts reflect On Balance Volume indicators - Charts courtesy Bigcharts.com) 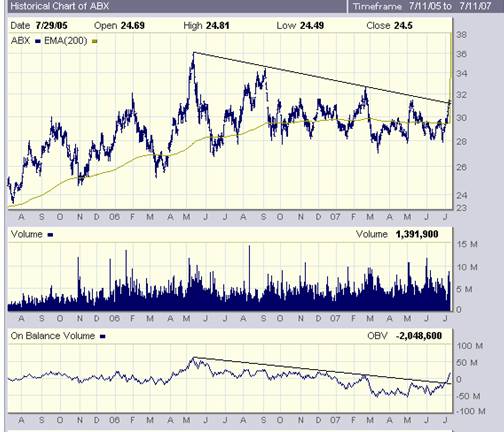 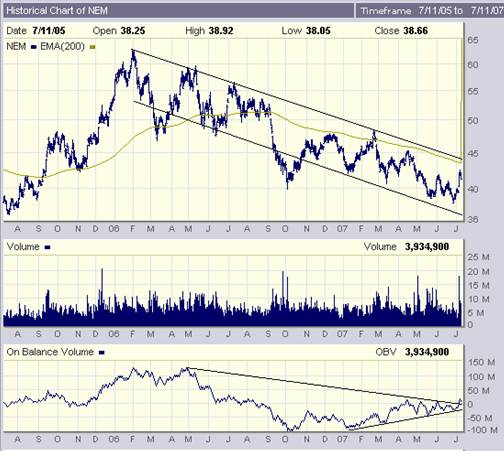 Although neither price chart has given any signals yet, the On Balance Volume charts of both have given buy signals. Tentatively, the big money is starting to move in. The weekly charts are also looking interesting. Again, although Barrick's share price has not yet given a buy signal (this time within a long term rising channel) both its RSI and the MACD indicators are showing strength. 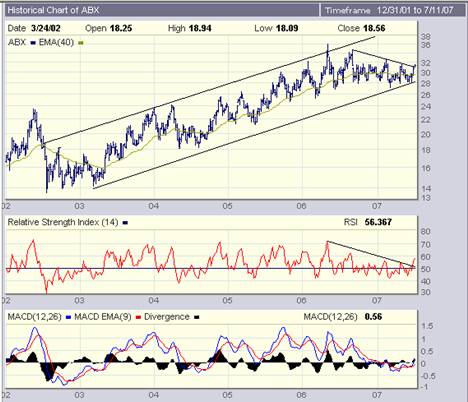 NEM's price seems to be moving within a bullish falling wedge, and there are bullish non-confirmations on both its RSI and the MACD indicators 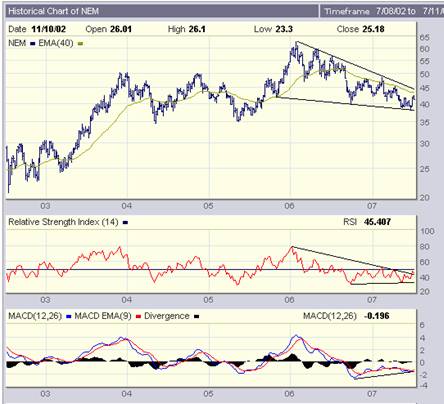 Interim conclusion There are tentative signs that Institutional money may be slowly moving into these two heavyweight gold counters. What could this mean? Quite simply, arising from the following 3 % X 3 box reversal chart (courtesy stockcharts.com), if a buy signal is given, we might expect a 45% up-move in the $XAU based on the horizontal count technique - but with the duration of the move not able to be determined. 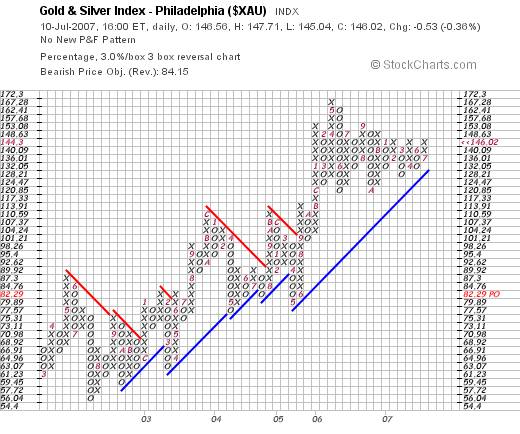 The following charts are courtesy stockcharts.com  Even though I don't trust the daily charts, this one looks a bit overbought to me. However, because it reflects a ratio of $XAU:$Gold maybe the Gold price is due for a run-up to catch-up. Yes, the following is a nice looking chart (again the daily, so we proceed with caution) 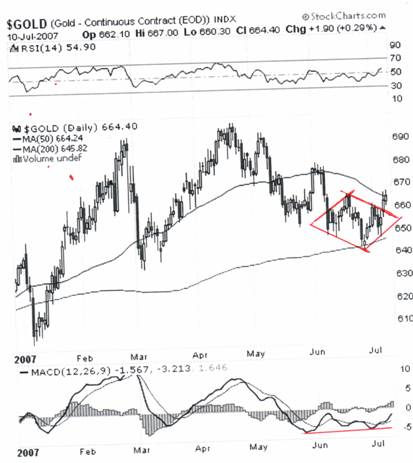 Here we see the makings of a "Diamond Reversal" Pattern. Happily, the gold price has already broken up from this pattern. There is also a bullish non-confirmation of rising bottoms on the MACD vs. falling bottoms on the price chart. Caution is advised here because the 200 day MA and the downtrend line may offer some resistance. The price might still pull back to the resistance of the diamond's boundary line. 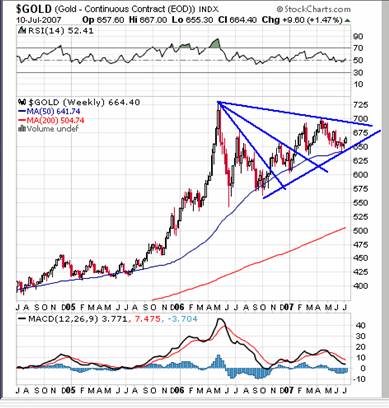 The above chart is particularly interesting. It shows a 3 line fan formation in the making - with $700/oz a key level. If the gold price should rise above $700/oz. it is this analyst's view that we will see some fireworks. This is a healthy chart with the MACD at fairly low levels. It is well positioned for a strong rise. Now here's where it gets interesting: The following P&F chart shows that a move to $670 will represent a buy signal - with $690 as the upside target based on the horizontal count technique 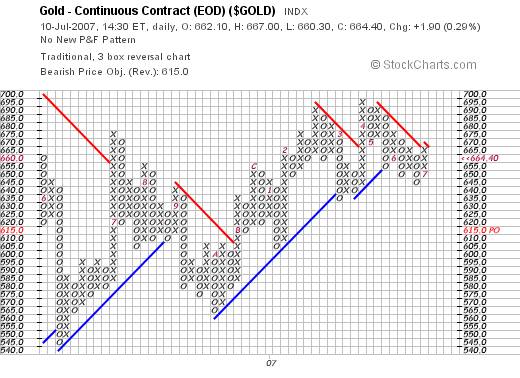 Overall Conclusion With Newmont and Barrick having shown leading OBV buy signals, the Gold markets seem poised for an upside leap, but there is still room for the Central Banks to step in before the $700/oz level. Key levels are:
If the $XAU gives a strong buy signal above the 150 level, the chances are it will lead the gold price to a strong buy signal above $700. In such an event, target for the $XAU is over 200. From prior analysis (not shown here) there is a technical argument to support a $1,400/oz longer term target for gold. It is emphasised that 'caution' is the watchword here: It would be unwise to resort to any form of leverage at this point. Given that the PM markets may be approaching an historic juncture, it is against the interests of the world's Central Bankers to allow the anticipated buy signals to manifest. Having said this, it is this analyst's view that their ability to be obstructive may be waning. i.e. In the longer term, the will of the overall market will prevail; and it will likely prevail in a rush. Unfortunately, timing is very difficult to call under the circumstances. Traders may find themselves whipsawed because vested interests are unlikely to remain sitting on their hands. This is unlikely to be a comfortable ride for the faint hearted. Author's Note: The past four weeks have been unusually active from an analytical perspective given that we have been approaching a decision point following months of uncertainty. From this point forward, further analysis will likely be counter productive. (Too much analysis leads to paralysis). We will now need to sit and wait for the markets to tell us what they want to do. This analyst will come back on line when there is something worth saying. Brian Bloom
Beyond Neanderthal Via the medium of its light hearted storyline, it examines how the world has gotten itself into the horrific quagmire of economic and social problems with which we are now faced - and puts forward one possible course of action on which we might embark to dig ourselves out. It may be ordered over the internet via www.beyondneanderthal.com. Or purchased from Amazon. 321gold Ltd |