Gold & Dow - Update
(Policy Implications)
Brian Bloom
Jul 9, 2007
Regular Readers will be aware
of the fact that I have recently had the temerity to stick my
neck out and call for a strong rise in the Gold price and precious
metal related investments.
The two charts below - courtesy
Bigcharts.com - are particularly illuminating
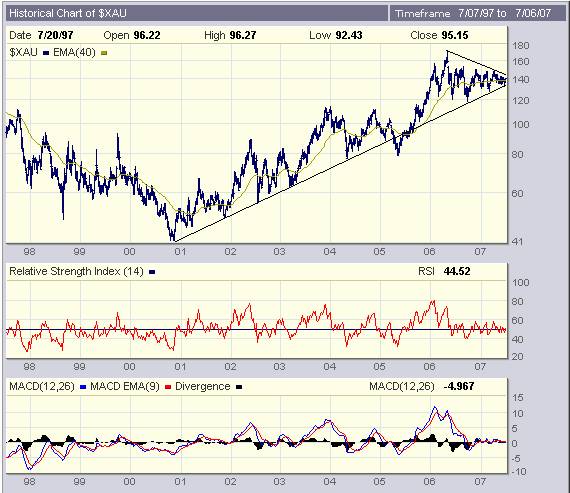
The weekly log scale chart
of the $XAU (which typically leads the gold price) is reaching
for the apex of a triangle. Of course, it could break down from
here, but I have formed the view that, given that gold is clearly
in a Primary Bull Trend at any level above $585/ounce, any such
breakdown is likely to be false and, indeed, the direction of
the break is more likely to be "up".
My view is predicated largely
on the conclusion that, in the war between the forces of inflation
and deflation, the forces of inflation seem likely to win at
this point in time.
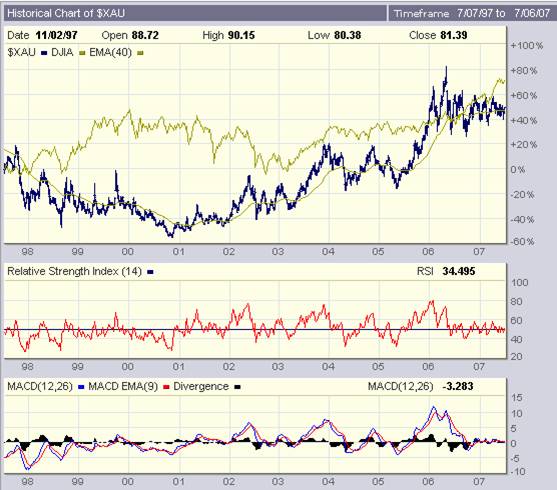
The weekly chart below,shows
the $XAU relative to the Dow Jones Industrial Index. It can be
seen that the $XAU bottomed out in late 2000 (at a point where
the distance between the Dow and the $XAU was at its greatest)
In early 2006, the $XAU caught
up with the Dow and has since been marking time whilst the Dow
has been rising to higher levels.
Of course, this begs the question
as to 'Why has the Dow risen to new highs?'
My own view - expressed in
previous articles - has been that underlying commercial value
has played a lesser role than weight of money. It seems likely
that a wave of money has been deliberately thrown at some of
the major components of the Dow to cause the Industrial Index
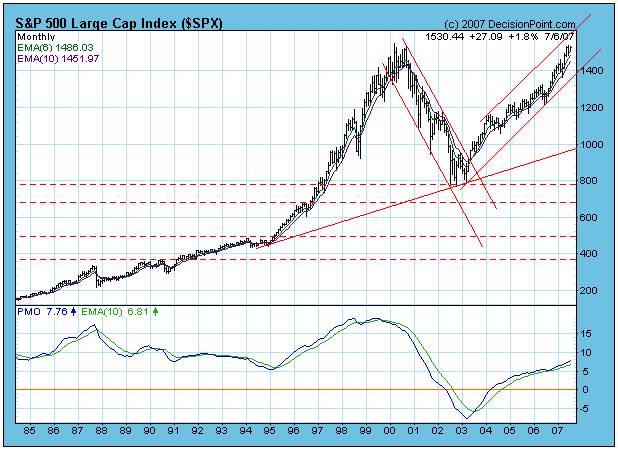
to rise. This view has been based on the fact that the broader
market as represented by the $SPX has not risen to new highs,
and that the industrial equity markets as a whole are extremely
vulnerable to severe pullback (if not collapse) as a result of
this non confirmation. In short, vested interests are attempting
to 'manage' the markets.
Chart, courtesy Decisionpoint.com
The logic runs something like
this: If the Dow Industrials could be "ramped" so as
to cause a feeling of euphoria in the markets leading up to the
Presidential elections, then it is likely that the $SPX will
also rise to new heights (regardless of whether or not this is
objectively justifiable by underlying values), and this will
cause the $XAU (gold and silver shares) also to rise.
In this event, by reference
to the Relative Strength chart above, the $XAU will have some
significant catching up to do, and will likely rise at a much
faster pace than the Dow.
This expectation is validated
by the following (daily) Relative Strength Chart (courtesy stockcharts.com)
but caution should be exercised because daily charts are not
particularly reliable nowadays.
Note the strong non-confirmation
of rising bottoms in the MACD and falling bottoms in the price
chart; and also the "fact" that the RS chart has penetrated
its 200 day MA to the upside.
Arguably, the weekly chart
below is even more interesting:
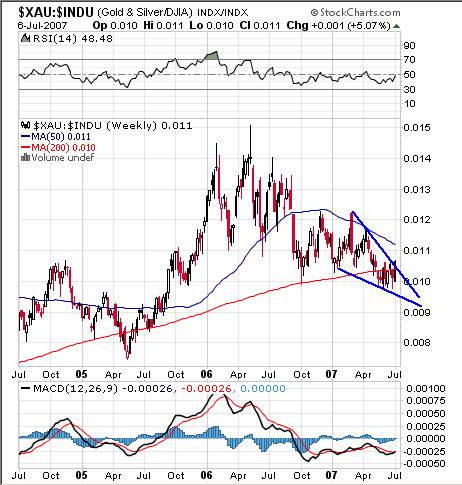
Note the same non confirmation
of rising bottoms on the MACD and falling bottoms on the price
chart. Note also the uncovered gap at the 50 week MA which occurred
in around September 2006. Note also the falling wedge pattern
in the RS chart which appears to be reaching its apex. From these
various indicators, a ratio of at least .012 may be expected
in the medium term. Finally, note that the RSI has some significant
upside potential before it reaches overbought territory.
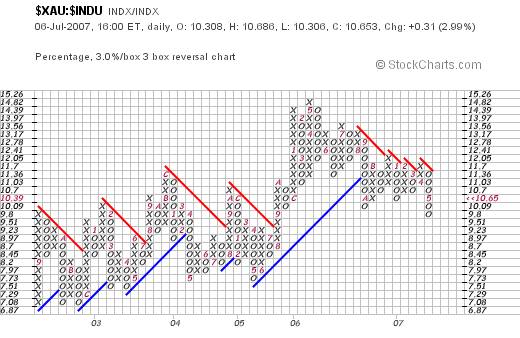
For the sake of completeness
and objectivity, the following 3% X 3 box reversal chart of this
same relationship is not as clear cut because it is showing the
"possibility" of a further fall to a level of 9.23
(0.00923). That this is a possibility as opposed to a probability
flows from the fact that at its recently lowest level of 9.8
it had reached its targeted destination based on the horizontal
count measuring technique from its previous breakdown
from the 11.7 level in 2006. Arguably, having reached the 9.8
level, it may reverse from this point rather than continue down
to the 9.23 level.
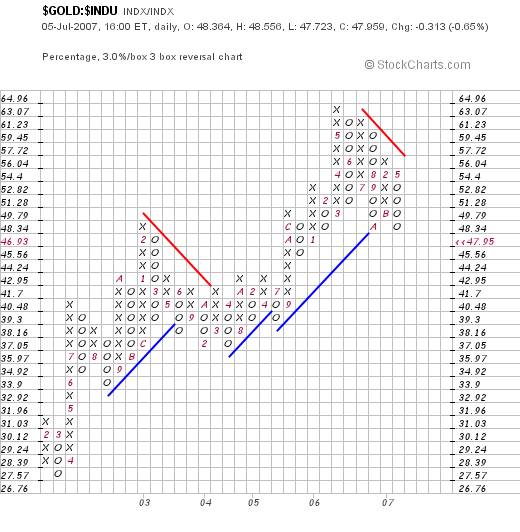
This latter argument is supported
by the R/S chart of the Gold Price divided by the Dow below,
which shows very limited further downside potential in this particular
relationship
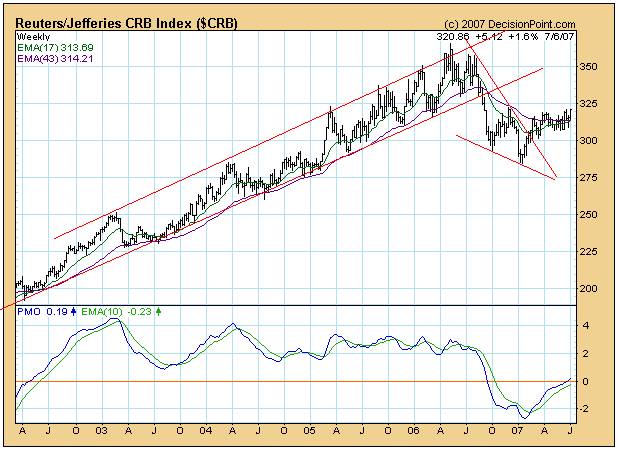
Also of interest is that (in
the context of gold being a commodity) the weekly chart of $CRB
index below shows:
1. Price has broken up out
of a falling wedge - implying a minimum upside target of 350
2. Price is above both its 17 week and 43 week MA
3. The 17 week MA, whilst still below its 43 week MA, is rapidly
rising towards it.
4. At any price above 322, the $CRB should enter a strongly rising
trend as it breaks above the neckline of a reverse Head and Shoulders
formation.
Caution: Except on the daily chart, none of
these breakouts has yet occurred. No actual signals have been
given. My view that the breakouts will be to the upside flows
from subjective interpretation rather than objective interpretation
of the charts.
Nevertheless, the primary driver
of my logic flows from 25 years of having watched the Central
Banks "managing" the markets when the need arose. It
all began with a decision by the Reagan administration - facilitated
by a structure that was put in place in 1913; and aided and abetted
by the players in the Derivatives Industry.
The question has been posed
by one reader: "If the Central Banks can 'manage' the Dow
upwards, why can't they manage the gold price downwards at the
same time?'
Of course, historically, they
have done just this on occasion and the answer is that anything
is possible but, in my view, it is not possible to fight a Primary
Trend. If the Central Banks move to artificially cause the
industrial markets to rise, they cannot have their cake and eat
it too. Money will flow into all industrial and
commodity markets because of a rising perception of emerging
inflationary pressures. The gold market, being a tightly traded
market, will become exponentially more difficult to manage if
the entire tide is coming in. In the end analysis, the Gold price
is the Central Bankers' Achilles Heel. I am currently of the
view (which, of course, I reserve the right to change at any
time) that the Central Banks have finally painted themselves
into a corner from which there is no escape. They are 'screwed';
and here's why:
If they continue to throw money
at the markets, the Dow may enter an exponential blow-off phase
which has been building since 1982, as can be seen from the chart
below - which dates back to 1920 (courtesy Decisionpoint.com)
Frankly, it is this analyst's
view that the Central Bankers are behaving in a particularly
ill-advised manner (if they are indeed actively involving themselves
in the markets at this point).
Technically, if the upper trendline
is penetrated to the upside then the situation will become unmanageable
by any force on Earth. Once the blow-off phase has developed
a head of steam there will be no stopping it. Like any other
biological phenomenon which reaches such a phase in its evolution,
the blow-off will end in catastrophic collapse from which there
will be no recovery. The blow-off phase may last anything between
5 to 12 years. (ending at some time between 2012 - 2020)
That this upside penetration
seems possible can be observed from the following two charts:
(Also courtesy Decisionpoint.com)
Note how the Transport Index
is currently bumping its head against the upper trendline, and
that the Utilities Index has already broken through!
Is there a way of avoiding
a catastrophe?
Yes, I believe there is, but
a condition precedent is that Ego needs to make way for humility.
Ultimately, the cause of this
emerging blow-off pattern arises from an unwise decision on the
part of the Reagan Administration, taken around 1982, to stimulate
the world economy by turning the USA into a deficit economy.
This was a decision that was inspired by the erroneous Central
Bank belief that "money" is what drives the economy.
Well intentioned (but ill advised) individuals such as previous
Fed Chairman Alan Greenspan believed that money supply can provide
a mechanism for controlling the speed of the economy.
Of course, this is true under
certain circumstances. However, ultimately, one can only control
the speed of any vehicle if that vehicle's engine is in good
working order. If you feed increasing amounts of gas to get ever
increasing revs per minute from an ageing engine, the consequence
is likely to be a cracked cylinder head of a blown gasket or
something equally serious. Money supply is the gas that
fuels the energy engine of the world economy. i.e. The
engine of the world's economy is energy (not money),
and that engine is badly in need of overhaul, preferably total
replacement.
The way to avoid this looming
catastrophe, in this analyst's view, is to throw out the old
(Neanderthal) Fossil Fuel driven engine and replace it with a
new economic engine based on a suite of New-Paradigm energies.
(As an aside, Nuclear Fission is not the way to
go).
What we should be actively
doing is managing the markets sideways - for upwards of two to
three decades - until the Dow Jones once again comes into contact
with its lower trendline; from which is can then start rising
healthily once again.
The dates all line up. If we
fail to implement these new energies, and we fail to manage the
markets sideways, the exponential blow-off will explode upwards
and peak out between 2012 and 2020. Fascinating to this analyst
is that the period between these two dates is in line with when
Khabibullo Abdusamatov is arguing our Sun will reach a critical
phase of its cooling cycle, and the Earth once again enter a
long term Ice Age. (Abdusamatov is high profile opponent of the
Greenhouse Gas/Global Warming argument. The term 'Ice Age' is
mine, not his). With this outcome in mind, if we have not put
those new energies in place by then, it will be all over bar
the shouting.
Are appropriate new energy
paradigms available?
Yes, I believe there are three
such energy technologies. They are described in some detail in
my novel, Beyond Neanderthal.
In conclusion, we need to differentiate
between arrogance and intelligence. Whilst (unhappily) society's
leaders are primarily motivated by their drive for personal aggrandisement,
they are (happily) typically not stupid. The 80 year charts above
still show some small room for manoeuvre. The situation is still
retrievable even if the markets are ramped up in the lead-up
to elections. But our "leaders" are playing an extraordinarily
dangerous game. If I had to make any recommendations, it would
be this:
Develop a zero tolerance
for any misbehaviour on the part of elected officials. Have a
read of what Thomas Paine had to say about how elected officials
should be behaving - by reference to http://www.ushistory.org/PAINE/commonsense/index.htm
. In my view, the time for game playing has passed. Waffle and
bullshit are no longer acceptable. It's time to bring to heel
those who should be representing the public. Regardless
of your political leanings, it's time to hold the politicians
accountable for their actions. This may be our last opportunity.
Let's not blow it!
Jul 7, 2007
Brian Bloom
Australia
website: www.beyondneanderthal.com
email: info@beyondneanderthal.com
 Since 1987, when Brian
Bloom became involved in the Venture Capital Industry, he has
been constantly on the lookout for alternative energy technologies
to replace fossil fuels. Since 1987, when Brian
Bloom became involved in the Venture Capital Industry, he has
been constantly on the lookout for alternative energy technologies
to replace fossil fuels.
Beyond Neanderthal
Brian Bloom's novel Beyond Neanderthal is a factional work
which took over twenty years to research.
Via the medium
of its light hearted storyline, it examines how the world has
gotten itself into the horrific quagmire of economic and social
problems with which we are now faced - and puts forward one possible
course of action on which we might embark to dig ourselves out.
It may be ordered
over the internet via www.beyondneanderthal.com. Or purchased from
Amazon.
321gold Ltd

|
